 Ndcharles Nweke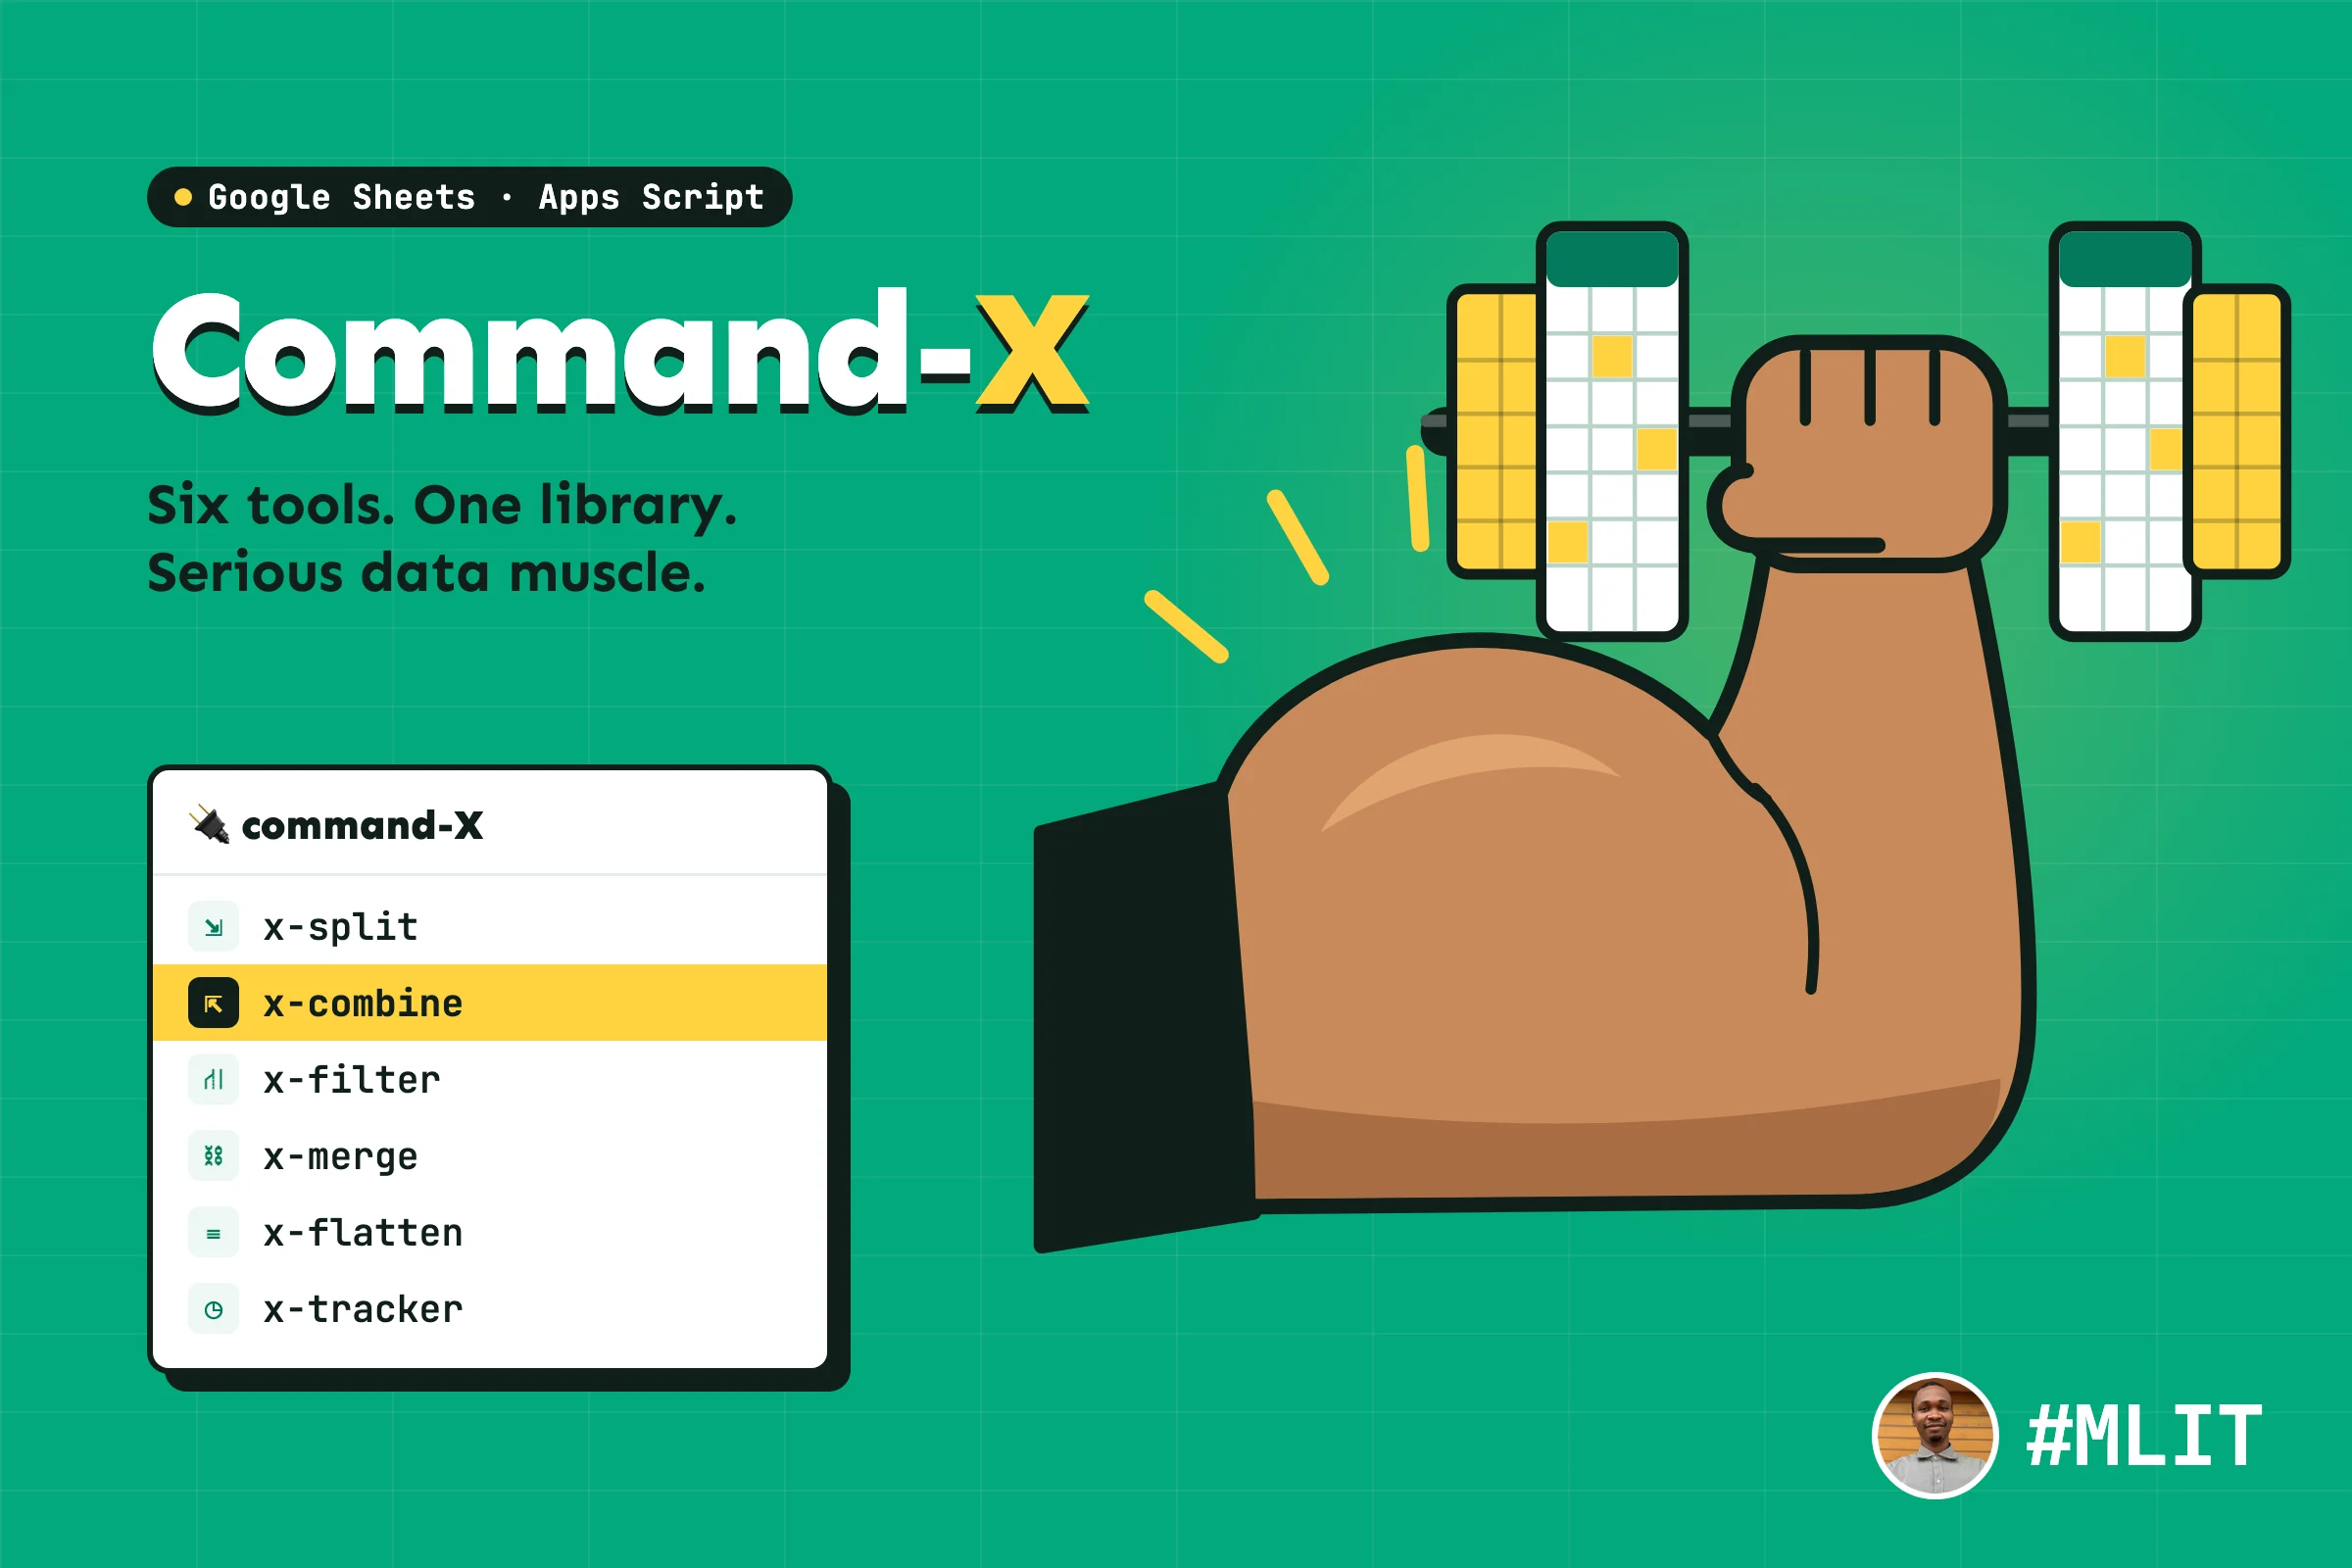
I built CommandX for one reason: I wanted all the tools I need for processing data in one place, not spread across several free and paid tools.
For a long time, Ablebits was my go-to. It’s a good add-on, but paying a subscription for occasional use didn’t make sense. Now I need a tool for constant usage, and something I could hand to the rest of the team, since I couldn’t ask everyone to buy their own subscription.
Sharing turned out to be the hardest part. Some of the people I work with use our work email, and others use their agency email. Tools that work nicely inside one company account often break once someone from outside that domain needs access. Whatever I used had to work for all of them.
So I built my own.
When I choose tools for the team, I try to pay only for what we use, and I build only when nothing fits. CommandX is the clearest example of that last case. No single product did the whole job, and paying for several of them would have meant monthly bills for a tool that is mission-critical.
The job it was built for
The easiest way to explain CommandX is to walk through a call cycle. The toolkit was built for my Google Sheets CRM.
We run a call centre of 15 agents making over 4,500 calls a week to learners and leads. Every cycle looks roughly like this:
- A large list lands in one sheet, sometimes thousands of rows. It gets cleaned.
- The list is shared out, so each agent gets their own tab with their own contacts.
- Agents call, update the status of each contact, and add notes. These new entries get synced with a master list.
- New leads keep arriving during the week and need to go to the right agents.
- At the end, the master list is used for reporting.
Before CommandX, I got through this with a mix of split sheets, the Ablebits Power Tools add-on and a lot of copy-and-paste. Formulas had to be copied from sheet to sheet, and every copy was another place for something to break. It also meant the process lived in my head. If I went on leave, handing it over to someone else was hard.
Each part of CommandX was built intentionally to handle one step of that cycle.
What each piece does
x-split: share the list across tabs. You pick a sheet and choose how to divide it: a fixed number of rows per tab (say 300 contacts per agent), or by the values in a column. It creates the tabs, copies the header and column widths, and can lock columns so agents can’t change data they shouldn’t touch. I can also append new leads to agents’ existing tabs (I run this append flow more often than the split into new tabs).
One small decision here saves me a lot of trouble; when I add new leads or append data, anything that doesn’t fit goes to a “left-over” tab instead of being dropped.
x-tracker: record when things happen. This one runs in the background. When an agent updates a column like “Initial call”, the tool stamps the date in a matching column like “Initial call date”. You can lock the date columns, so the dates only come from the tool and can’t be typed in by hand.
This is what makes our 24-hour response time measurable and time-bound reporting possible. Without real timestamps, “we responded within a day” is a guess.
x-combine: bring it all back. Select the agent tabs (or all of them), and CommandX stacks them into one master tab, with an optional column showing which tab each row came from. You can make it a one-time copy, or a live formula version that updates on its own whenever an agent edits their tab.
Before it combines anything, it shows a quick preview of the columns in each tab and how often each one appears. That’s how you notice that one agent renamed “Phone” to “Phone Number” before it breaks your report.
x-merge and x-flatten: One person can apply to several programmes, so the same email shows up on several rows. x-merge collapses them into one row per person, with their programmes listed together, like “VA, AICE”. The columns to merge can be anything other than programmes, plus other options available in the add-on menu. x-flatten does the reverse: it takes a cell with several values and splits it back into one row per value, which is what you want for some kind of analysis.
x-filter: pull out what you need. Choose a column, tick the values you want, and get them in one tab or one tab per value. Like x-combine, it can be a snapshot or a live view.
From copied scripts to one shared library
The first version of CommandX was a script I copied into each spreadsheet that needed it. That worked until I had to fix something. Every fix meant finding every copy and updating it by hand, which was the same copy-and-paste problem I was trying to escape.
In March 2026, I moved everything into a single Apps Script library. Now each spreadsheet has a short piece of setup code that points to the library, and the real work happens in one place. I fix a bug once, publish a new version, and every sheet can use it. It also solved the sharing problem: anyone I give access to can use it, whatever email they’re on, and nobody needs a subscription.
Around that, I added the things I’d expect from any tool the team relies on:
- Version checks. Every sidebar shows the version you’re on. If a newer one is out, you get a notice telling you how to update.
- A changelog inside the tool, so people can see what changed and when.
- A help manual with a tab for each tool, so nobody needs me on a call to learn it.
- An install guide that gives you the setup code to copy into a new sheet.
None of this is complicated code. It’s the same thinking you’d apply to any system a team depends on: one source of truth, controlled releases, documentation, and a clear way to update. That’s the part of this project I’m proudest of, and it’s the part that carries over to any IT or operations role.
If you want to build something similar
You don’t need to be a developer to do this. Most of CommandX is plain logic: loop through rows, group them, write them somewhere else. These are the lessons that made the difference for me:
- Start with a job you repeat every week. Write down every step you take, including the annoying ones. The annoying steps are what you’re automating.
- Check what you’re paying for. If you’re on a subscription for something you use a few times a month, add up what it costs you per use. That number is often the push you need.
- Build for the person who’ll use it. Agents and team leads don’t want to write formulas. A menu and a sidebar with dropdowns and checkboxes means anyone on the team can run it without breaking anything.
- Decide between live and snapshot. A live formula keeps updating as the source changes, which is great for a master list. A snapshot stays fixed, which is better for a record of what happened on a given day. Give people the choice.
- Put it in one place early. If more than one sheet needs the tool, make it a library from the start. Copying scripts around feels faster until the first bug.
- Plan for the day you’re not there. A tool only you can run is a risk to the team. Explaining each step in plain words in a help page shows you which steps are too complicated, and it means someone else can pick up the work when you’re on leave.
What it changed
Splitting a sheet or appending new data now takes seconds, and anyone on the team can do it once they have the data. It doesn’t have to wait for me.
I can add timestamps to any column people fill in, merge several programme applications into one row per email whenever I need to, and use the same tool across as many sheets as I like. When I’m away, the work carries on.
Looking back, CommandX passed every question I ask before choosing a tool. What does it need to do? Six connected jobs that no single product covered. Who needs it? Anyone on the team, including people on agency emails outside our domain. How often? Every call cycle (almost weekly). What does it connect to? Nothing outside the sheet, because the work already lives there. Was there a deal on a ready-made option? Ablebits came closest, but a subscription wasn’t the best decision, and it didn’t have everything I needed.
When the answers look like that, building is the cheaper and better option. I wrote more about how I make that call in Paying for What We Use.
What’s next
I’d like to turn CommandX into a proper Google Workspace add-on for my own use, so it’s there in every sheet without any setup. I looked into it, and the process involves more steps than I have time for right now, so I’ll come back to it later.
Until then, you can use it the same way my team does, as a library.
See the setup steps below, and tap the button to show the code:
- Open the Google Sheet you want to use it in.
- Go to Extensions > Apps Script.
- Click + next to Libraries and paste this Script ID:
1lmhlX_ZrCyR4KVGP9rbo51ZpCNSIXgBJheOY_7JBMhSxLMy0vr8dAUhK - Make sure the identifier is CommandX, pick the latest version, and click Add.
- Delete everything in Code.gs, paste the code below, name the project and save.
- Reload your sheet. You will see a new Command-X menu.
- Optional, for x-tracker: change the tab and column names in the settings to match your sheet. Then in Apps Script, go to Triggers, add a trigger for
adminOnEditwith the event type On edit, and save.
Show the setup code
Command-X Client Script
This is the library code to add to code.gs
// command-X Client Script
function onOpen() {
SpreadsheetApp.getUi()
.createMenu('🔌 command-X')
.addItem('⛓️💥 x-split', 'openSplit')
.addItem('⛓️ x-combine', 'openCombine')
.addItem('⛙ x-filter', 'showFilter')
.addSeparator()
.addItem('⛓ x-merge', 'openMerge')
.addItem('𝌤 x-flatten', 'openExpand')
.addSeparator()
.addItem('❓ How this library works', 'showHelp')
.addItem('📖 Run this library in another sheet', 'showSetupInstructions')
.addToUi();
}
// Sidebars (update for each function)
function openSplit() {
const html = CommandX.getLibraryHtml('sidebar').setTitle('x-split').setWidth(420);
SpreadsheetApp.getUi().showSidebar(html);
}
function openCombine() {
const html = CommandX.getLibraryHtml('combineSidebar').setTitle('x-combine').setWidth(420);
SpreadsheetApp.getUi().showSidebar(html);
}
function showFilter() {
const html = CommandX.getLibraryHtml('filterSidebar').setTitle('x-filter').setWidth(420);
SpreadsheetApp.getUi().showSidebar(html);
}
function openExpand() {
const html = CommandX.getLibraryHtml('expandSidebar').setTitle('x-expand').setWidth(420);
SpreadsheetApp.getUi().showSidebar(html);
}
function openMerge() {
const html = CommandX.getLibraryHtml('mergeSidebar').setTitle('x-merge').setWidth(420);
SpreadsheetApp.getUi().showSidebar(html);
}
/**
* =========================================
* X-TRACKER CONFIGURATIONS
* This tracker is used to track datetime for sheets being logged.
* See the configuration details below or in the help modal of Command-X
* =========================================
*/
// SETUP A: The 1-to-1 Mapping (Specific columns trigger specific dates)
const ONE_TO_ONE = {
trackedTabs: ["Asonwa", "Kate", "Seun"],
headerRow: 1,
columnMap: {
"Initial call": "Initial call date",
"Follow-up": "Follow-up date"
}
};
// SETUP B: The Many-to-1 Mapping (Any of these columns trigger one master date)
const MANY_TO_ONE = {
trackedTabs: ["Asonwa", "Kate", "Seun"],
headerRow: 1,
watchColumns: ["Dropdown", "Call date"],
timestampColumn: "Logged date"
};
// Google Sheets Simple Trigger to ensure the time tracker logs successfully
function adminOnEdit(e) {
runTracker(e, ONE_TO_ONE);
// To switch setups, just comment out the line above and uncomment the line below:
// CommandX.runTracker(e, MANY_TO_ONE);
}
// BRIDGE: Passthrough functions so the sidebar can find them. (update for each function)
function getSpecificSheetData(name) { return CommandX.getSpecificSheetData(name); }
function getInitialData() { return CommandX.getInitialData(); }
function getSheetNames() { return CommandX.getSheetNames(); }
function getSheetSchema(names) { return CommandX.getSheetSchema(names); }
function getUniqueValues(sheetName, rangeA1, colIdx, hasHeaders) { return CommandX.getUniqueValues(sheetName, rangeA1, colIdx, hasHeaders); }
function runSplit(opts) { return CommandX.runSplit(opts); }
function runCombine(opts) { return CommandX.runCombine(opts); }
function runFilter(config) { return CommandX.runFilter(config); }
function runExpand(opts) { return CommandX.runExpand(opts); }
function runMerge(config) { return CommandX.runMerge(config); }
function runTracker(e, config) { return CommandX.runTracker(e, config); }
function showHelp(tab) { return CommandX.showHelp(tab); }
function showSetupInstructions() { CommandX.showSetupInstructions(); }
Once it is installed, go to your sheet, and you will see the new add-on menu. Go to Command-X > How this library works walks you through each tool, and View Changelog in any sidebar shows what is new.
If you try it and something breaks, or you have an idea for a new tool, reach out. I’d like to hear how you use it.
A few notes on how it’s built (because the details matter 😊):
- Google Apps Script, published as a shared library with version checks
- HTML sidebars and a tabbed help manual inside Google Sheets
- Live views built on Google Sheets’
QUERYfunction - An on-edit trigger for automatic timestamps
- Column locking that is saved and restored when data is appended to protected tabs
- Six tools: x-split (with an append mode), x-combine, x-filter, x-merge, x-flatten and x-tracker
More tools are being built to serve my needs every day in IT and Data Operations. I will share more ideas around what I am building in due time: a daily payment tracker and weekly BigQuery uploader. All built with Drive, Apps Script, Data Studio, and BigQuery.
Okay, speak soon!


 Building ALX Connect - An AI-Powered Community Matching Platform
Comments