Ndcharles Nweke
Data Science & Analytics | Operations
A data generalist with experience in IT and operations, and everything business automations. My interest is in real-life applications of data to business and everyday problems.
Let's Connect
LinkedIn | Twitter | Blog |
View my Resume
Exploratory Data Analysis on Titanic Dataset
Exploratory data analysis (EDA) is an important pillar of data science. It is an important step required to complete every project regardless of type of data you are working with. Exploratory analysis gives us a sense of what additional work should be performed to quantify and extract insights from our data.
In this project I went through the general data analysis process using pandas, numpy, seaborn and matplotlib.
Method
We were provided data from Kaggle which contains information of all the passengers aboard the RMS Titanic, which unfortunately was shipwrecked. The data description is given below:
- Passengerld: Unique Id of a passenger
- Survived: If the passenger survived(0-No, l-Yes)
- Pclass: Passenger’s Class (1 = first, 2 = second, 3 = third)
- Name: Name of the passenger
- Sex: Male/Female
- Age: Passenger’s age in years
- SibSp: No of siblings/spouse aboard
- Parch: No of parents/children aboard
- Ticket: Ticket Number
- Fare: Passenger’s Fare
- Cabin: Cabin nunber
- Embarked: Port of Embarkment (C = Cherbourg; Q = Queenstown; S = Southanpton)
The first step after importing the data was to preview the details therein. This is by checking the columns. Previewing the dhead of the data. And taking a 5-number statistical summary.
Univariate Analysis
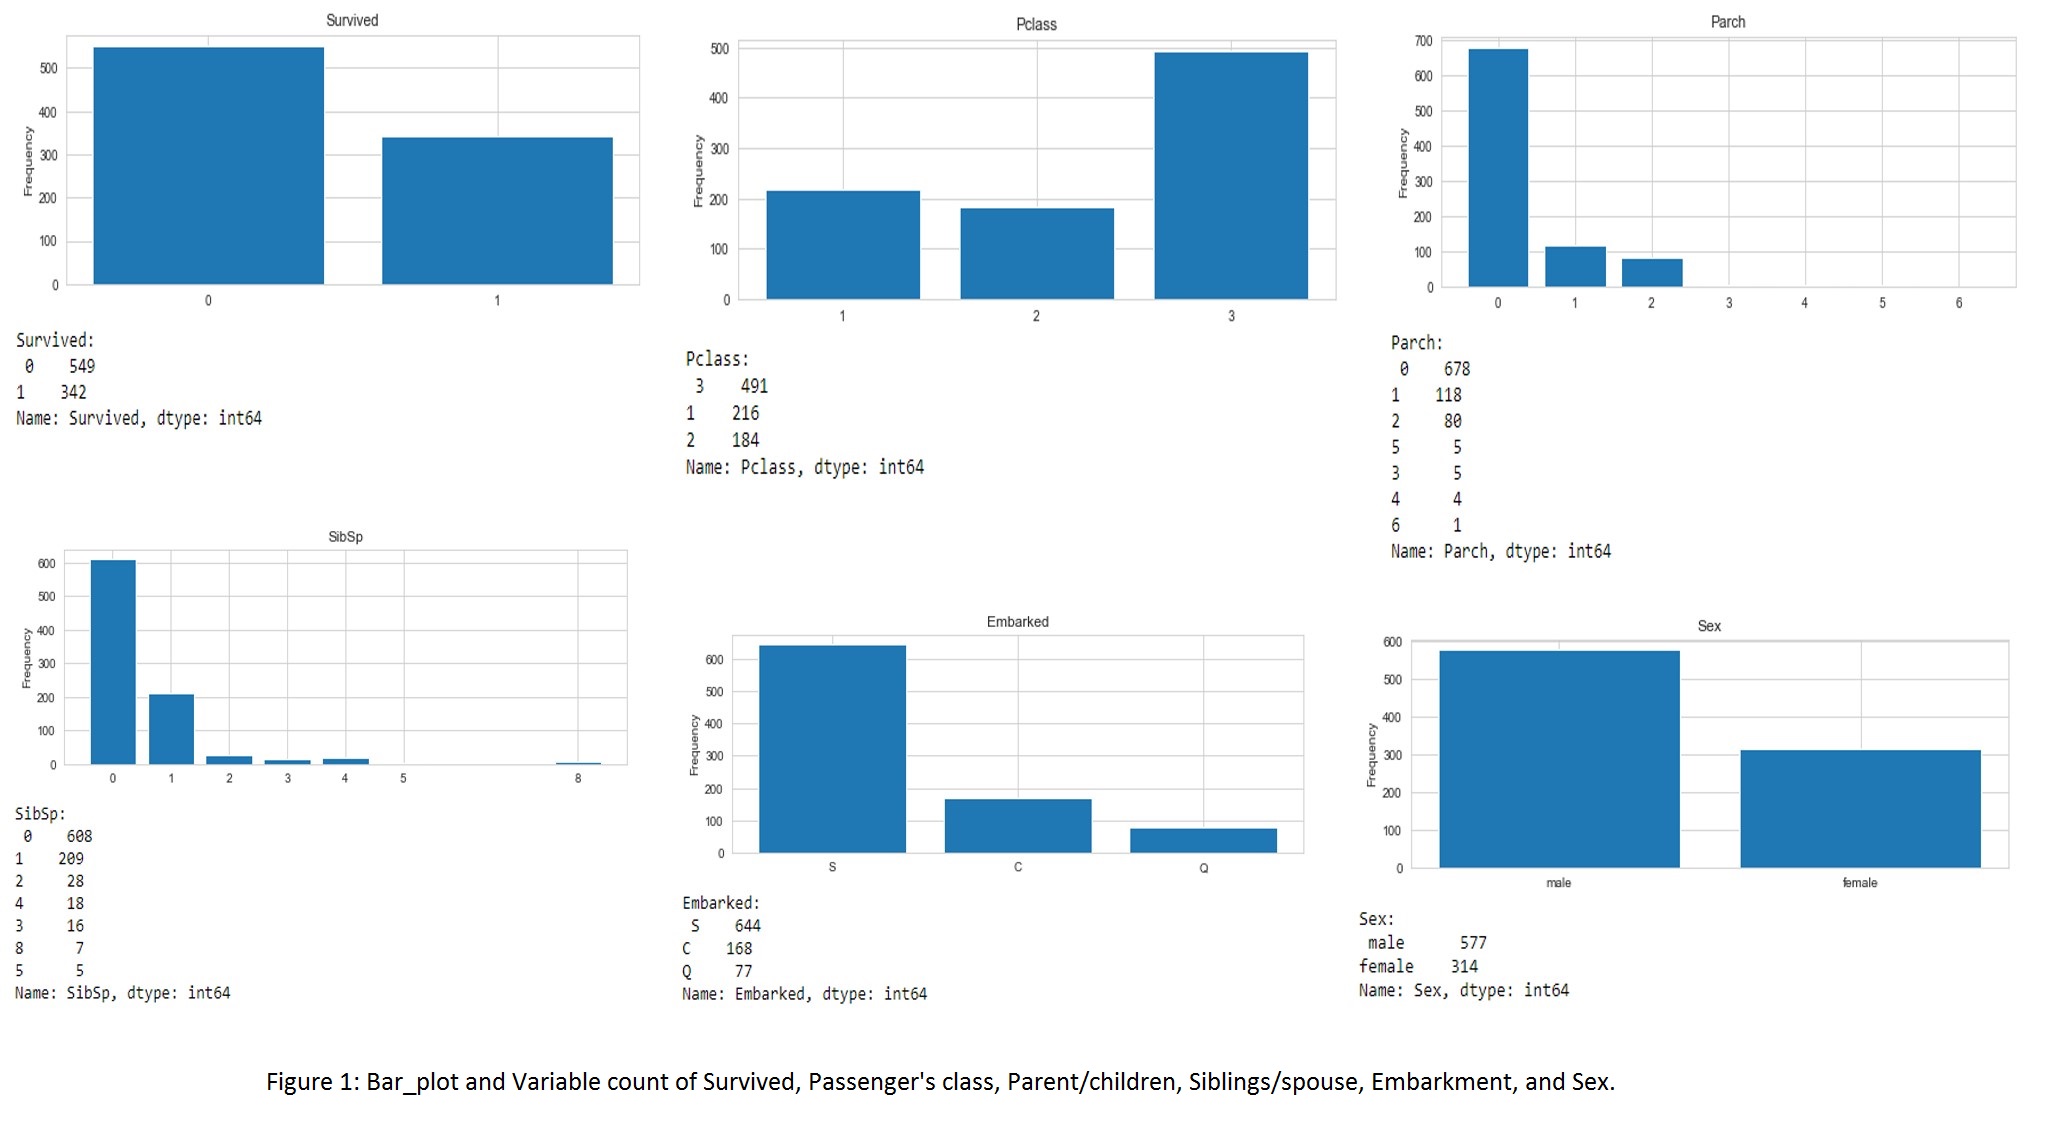
There are 9 categorical variables and 3 numerical variables. A bar plot function was created to plot the categorical variables and a histogram function for the numerical variables.


Bivariate Analysis
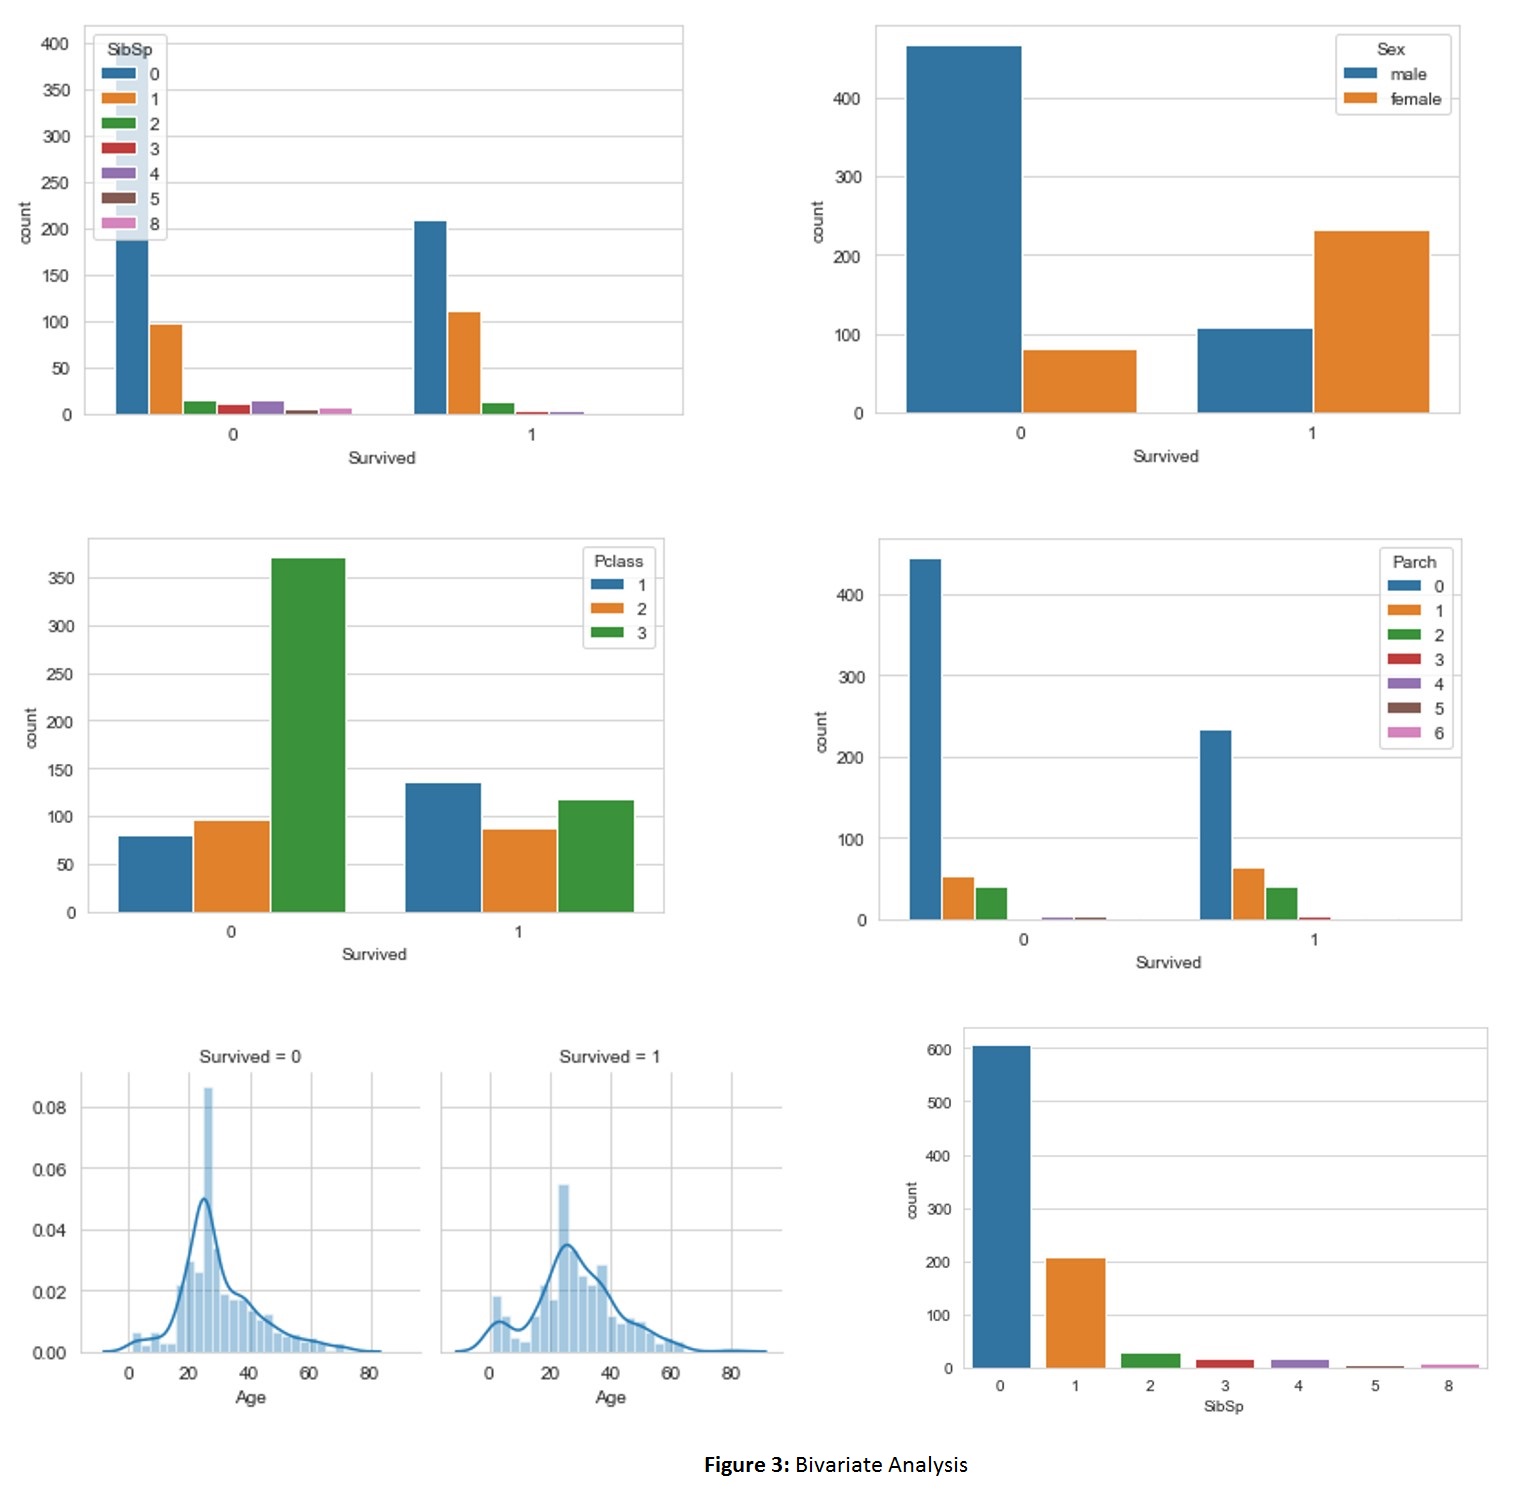
The aim here is to dig deeper into the dataset. To answer questions such as:
- How many passengers with a sibling or spouse aboard survived?
- How many males and females survived?
- How many of the passengers survived in each passenger class?
- What is the survival rate of passengers with a parent or child(ren) aboard?
- What is the survival rate with regards to their age?

From the above figure (left to right) we can deduce that:
- The lesser the number of spouse or sibling one has, the higher their chances of survival.
- More females survived while twice that number of men did not survive.
- More passengers in the lower class did not survive, more of the upper class did survive while the middle class fared moderately.
- More passengers came without a parent or child(ren). There was more death recorded for those without a parent or child and half of those survived.
- More of the passengers onboard are in their mid-twenties. The highest death was recorded for that population. They also survived more.
- From the plot of sibling/spouse and parent/children, it can be shown that majority of the population came alone.
Missing Values
A quick check on the data for missing values shows that Age is missing a couple of values (177). We have a lot of missing values in the Cabin column (687). And only 2 missing in Embarked column. The exact values missing were be gotten using .isnull().sum().

The following approaches were taken to treat the missing values:
- Fill in the missing Age value instead of dropping NA. Replacing all Age null values with the average of their respective Pclass.(Pclass, Age)(1, 38)(2, 29)(3, 25).
- Drop the Cabin column and the two null values in Embarked column.
What we have done
- Imported our data
- Explored its head, columns and statistical summary
- Perform univariate and bivariate analysis
- Find and replace missing values using average
- Also dropped some columns and rows.
[View my GitHub profile] | [Read the Blog]