 Ndcharles
At the beginning of most products, instincts, gut-feeling, interviews and surveys form the basis of decision making. After developement and people start using the product, data is generated. The available data is then used to validate hypothesis that would help in improving the product. This is when product analytics comes in.
I work in an ecommerce company and although, most conversations around product analytics tend to gear towards product-led companies, ecommerce can also take advantage of the product analytics journey.
What is Product Analytics?
Product analytics show you who your users are, what they want, and how to keep them. —Amplitude
Product analytics refers to capturing and analyzing quantitative data through embedded tools that record how users interact with a product. It is about using data to understand who your users are, how they use your product and how these affects your business.
Product Analytics can answer different types of questions ranging from trends to analyzing feature adoption or engagement over time, to visualizing intricate experiences and user flows inside or outside the product.
Why is product analytics important?
Product analytics allow companies to fully understand how users engage with what they build. It is especially useful for technology products where teams can track users’ digital footprints step-by-step to see what they like or dislike and what leads them to engage, return, or churn.
How to implement product analytics
- Step 1: Define your business goals
The first step is defining a clear-cut business objectives that you want to optimize using data. Then you can ask the right questions like how many people used the wishlist feature last month?, what percentage of users used the skin expert feature last month compared to this month?
To create good set of questions that accurately matches the data you have to your business goals, you should consider using the Product Analytics Question framework below by Matthew.
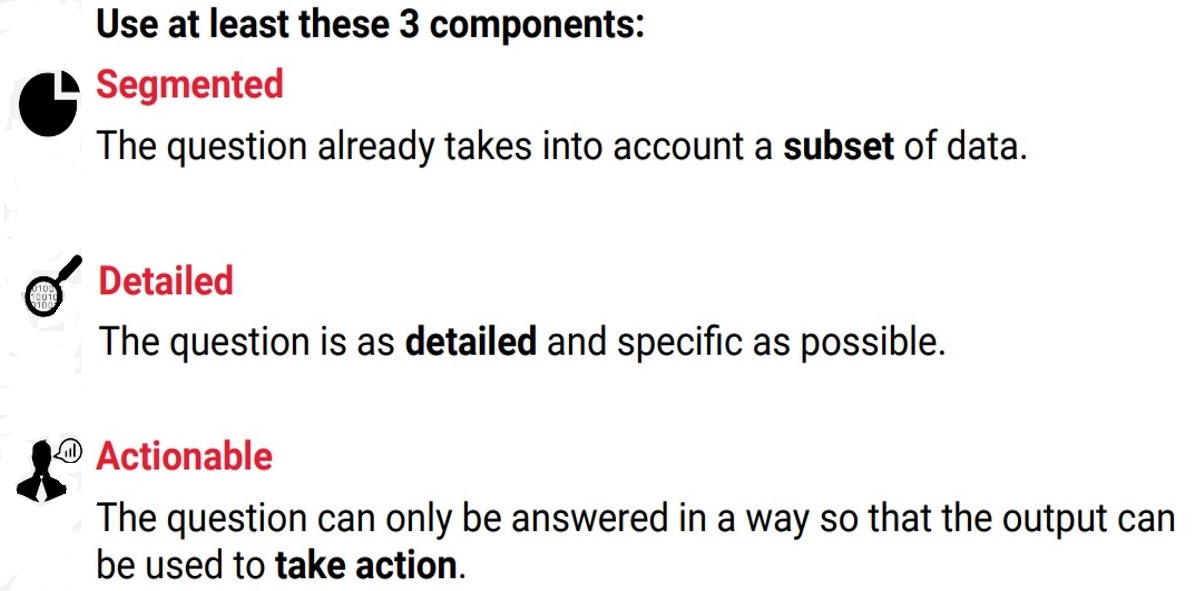
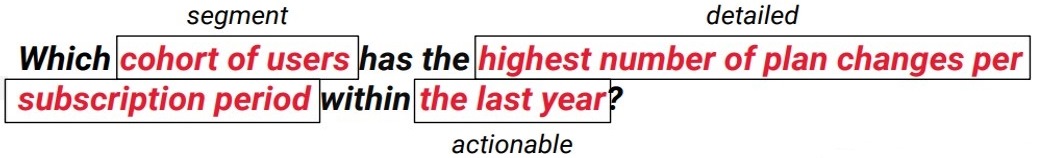
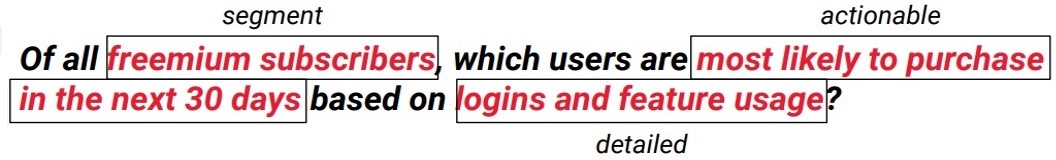
Example questions using the framework;
- Step 2: Create a tracking plan
Creating an analytics tracking plan helps us to collect the right amount of and correct data to cover our business use case. Incorrect data can lead to incorrect metrics and further misleading conclusions that end up marring the business decisions made from our conclusions.
A tracking plan is an Excel or Google Spreadsheet that contains all the events and properties that you would like to track. An event is simply an action that a user takes (e.g. signing up for your product, uploading a picture or adding a product to cart). Properties are attributes attached to each event (e.g. when a user signs up for our product we would like to know their userID, dateOfSubscription, subscriptionPlan (free or paid) and so on).
What do we track?
Anything that happens within our product e.g. button clicks, screen views.
Data scopes
Data scope tells us how data is put together.
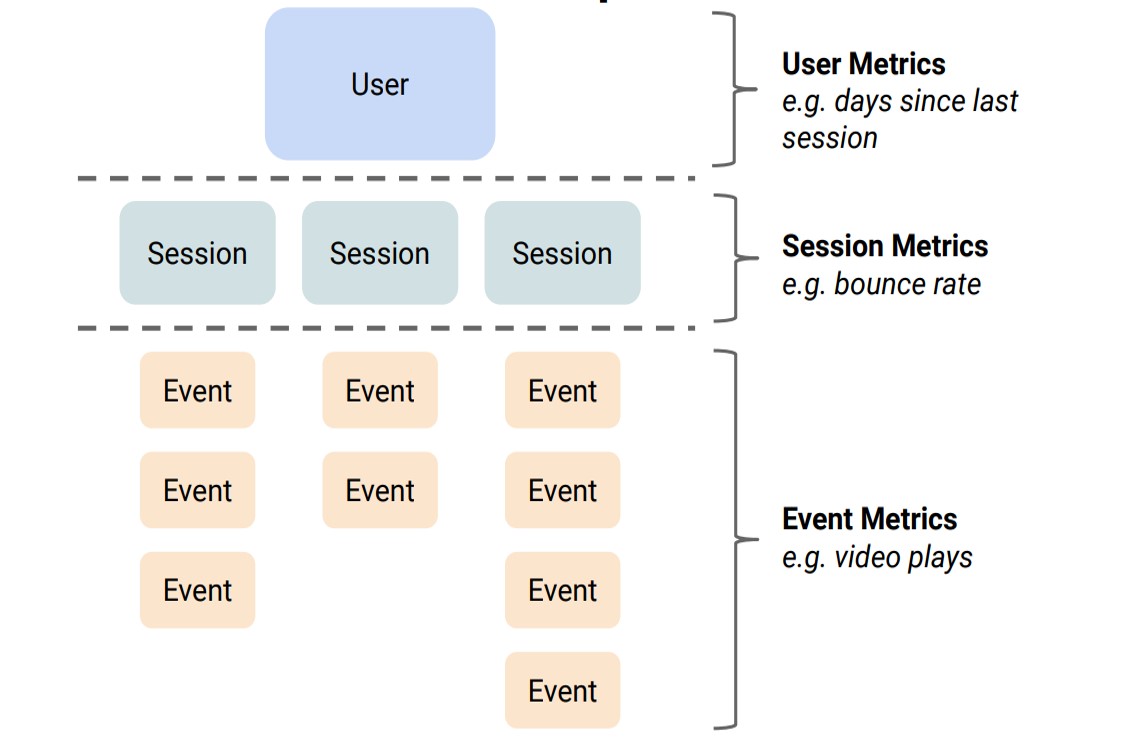 A single user can have multiple sessions, and each session can have multiple hits, as illustrated above.
- Users: Anyone interacting with your product is a user. Example user metric include, days since last session, monthly active users, feature adoption rate, etc.
- Session: Interactions by a single user are grouped into sessions. Example session metric is bounce rate.
- Events (or hits) is a collection of all interactions that happened during a session. Example event metrics include pageviews and video plays.
Properties
- User properties: A user has properties that are automatically captured by the analytics tool (e.g. location based on IP address, device used) or manually defined by you (e.g. user’s age, type of user).
- Event properties: Events also have properties. Although they aren’t used as often as user properties, they capture valuable metadata about the event itself (e.g. message sent from driver to rider is the first time they are messaging) or state of the user when the event was generated (e.g., Jane was 21 years old when she registered a year ago but is now 22).
To develop a tracking plan we; define key events, decide what context you need for them and then determine what we need to know about our users. Here is a sample tracking plan for e-commerce business.
For a comprehensive guide on creating a tracking plan, with templates you can use as inspiration, read this article.
DataLayer
DataLayer is a way to store semantic metadata based on users, sessions, products, content etc. We use it to create an easy way to access information on the website. DataLayers are used instead of scraping because they (dataLayers) are more reliable and don’t change as often as the website’s code.
What makes a good dataLayer?
- Tool-agnostic: It should be created for the sole purpose and not tied to a particular tool. e.g. userID NOT GAUserID.
- Generic: It should be able to satisfy several use cases. e.g. currentPlanName NOT proPlanSubscriber and;
- Consistent: Variable names should follow a naming convention and also be usable in different cases.
DataLayer helps us to debug our tracking setup and as well provides us with reliable and readily accessible values for reporting.
Also see: How I created an eCommerce Website DataLayer.
- Step 3: Choose the right analytics tools
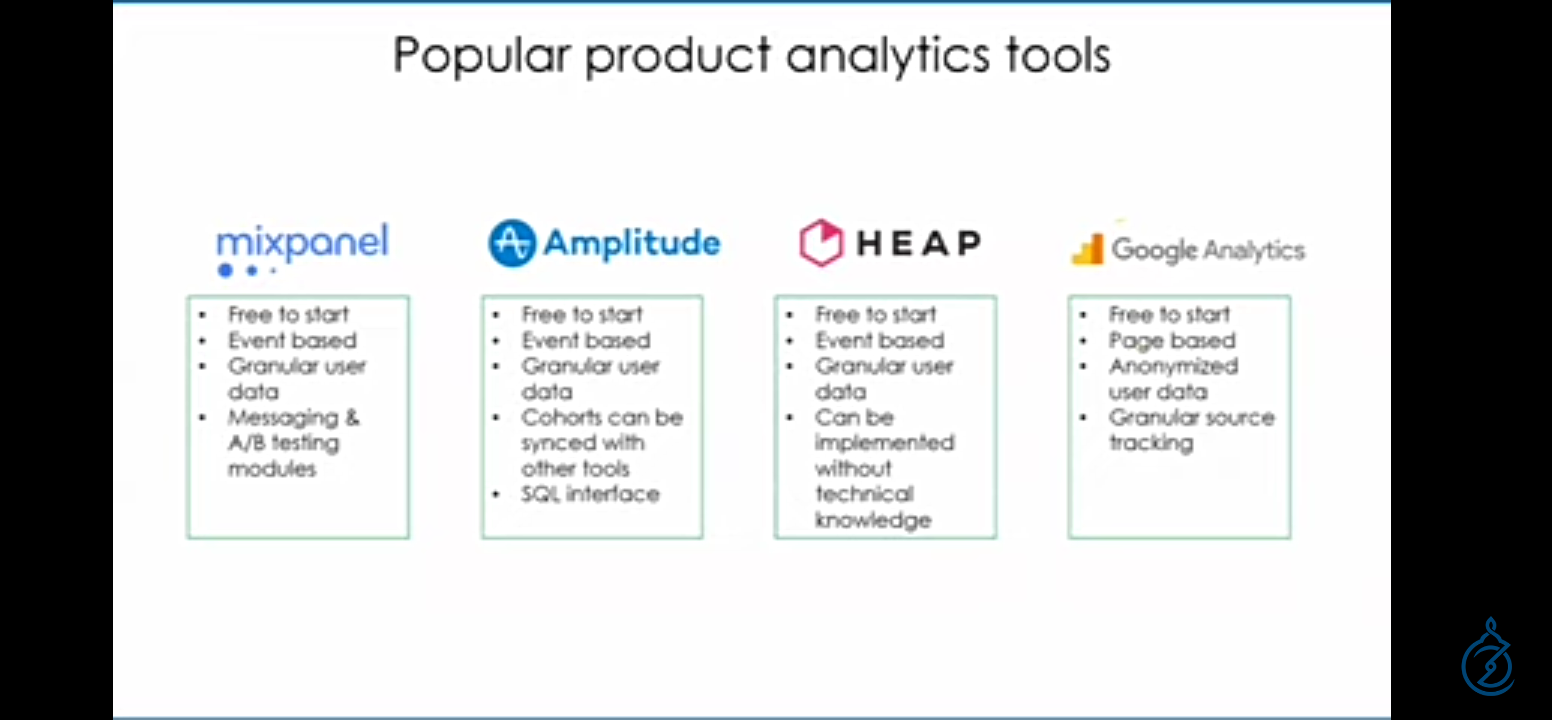 Some popular product analytics tools
There are two groups of analytics tools in use: the classic analytics and the retroactive analytics tools. The tools you use vary based on your business needs and requirements.
- Classic analytics captures pageview events by default (page-based) and other events that has been setup to be tracked on the website. It gathers data from the day you implement it. Google Analytics falls under this category.
- Retroactive analytics captures all events happening on-page by default (event-based). Tools in this category automatically collect user interaction data with a single snippet and let you analyze that data when you need to. Examples include mixpanel, heap and amplitude.
The difference between classic and retroactive tools is in the…
- Step 4: Follow a consistent process
What is the key information each team needs to look at weekly? How do you ensure tracking is in place for new feature launches?
A typical product analytics stack
- Segment: to connect all your tools together from mixpanel, Google Analytics to your website and CRM.
- Google Analytics (for marketing analytics), to gather top of the funnel page-view events.
- Mixpanel, Amplitude or Heap to understand what users are doing after signup.
Reporting analytics events
Reports are time-based and segmented views of product data. They can be shared, updated and embedded or self-created by users. They are visual guides that enable stakeholders understand the performance of the product’s metrics.
Dashboard is a collection of various reports.
Most useful reports in analytics
The reports used for the below section were generated from Google Merchandise Store Universal Analytics demo account. Visit the demo account information page for full details, tutorials and access limitations. Otherwise, you can go directly to the Universal Analytics property or the Google Analytics 4 property.
Segmentation
A segment is a subset of your Analytics data. Segmentation helps us to uncover and understand hidden trends within our product. It allows us to break down product analysis by event or user property, such as location or operating system.
With segmentation you can isolate and analyze a subset of data so you can examine and respond to trends in your business. For example, if you segment and realise that users from a particular region are no longer purchasing a particular product in the same volume as they normally do, you can check whether there is a competitor selling same product at lower prices. If this is true, you could respond by offering a discount that undercuts your competitor’s prices.
You can also use information gotten from segmenting your users to know what group of users to target in a remarketing campaign.
See this short but detailed explanation of segmentation from Google.
Cohort Analysis
Cohort analysis helps us to find out which group (segments) of users stay engaged with our product the longest. It also helps us to understand if our product has improved over time. i.e. if newer users are staying longer than older ones did.
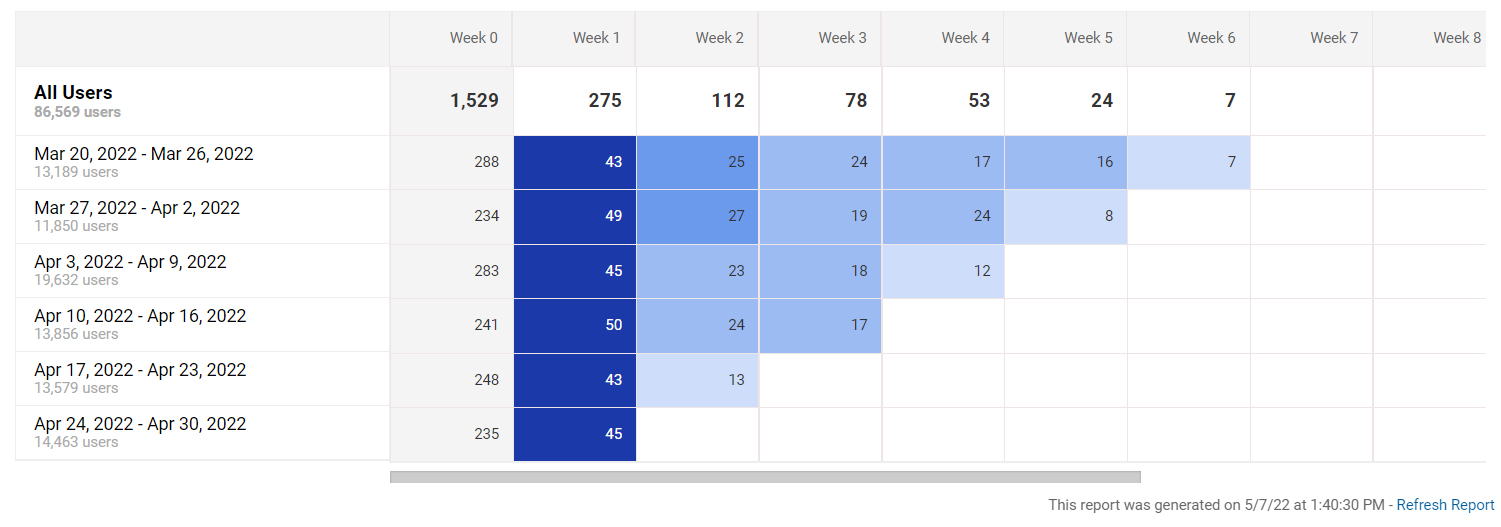
The above image shows a 6-week analysis of users grouped by Acquisition date and the Total transactions they carried out from their first week (Week 0) to the present week (Week 6). We can observe that the initial total transactions are high. However, the number of repeat purchase from these users drop rapidly as the week goes by. This drop could be explained by the type of products on the Google Merchandise store. These are not FMCG products. So a better cohort size would have been by month or year.
To understand cohort analysis further, read this article.
Funnel Analysis
Funnels are used to understand user behaviour usually in a specific order. It shows us data on users who have gone through a funnel we define (e.g. single product, add to cart, checkout, create account, complete checkout). Through this, we can identify user drop-off points to improve conversion rates.
User flows
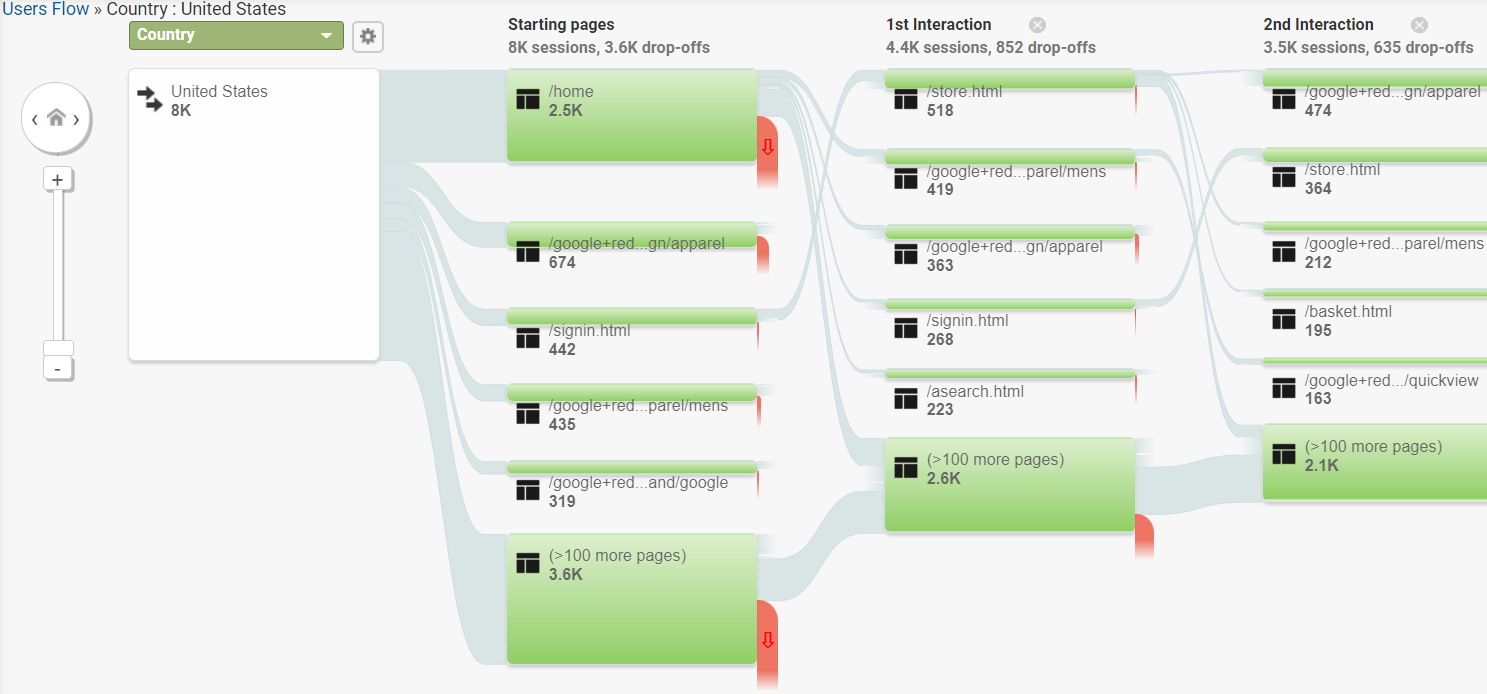
A flow analysis helps us to understand user behaviour in a less structured way than funnels. It helps to understand what events are key to reaching a goal and how users use our products outside how we intend them to use it.
It allows us to see where a user goes/does after a starting point (e.g. next five actions that a user did after visiting the landing page) or what the user did before an ending action (e.g. previous five actions user did before buying our product).
It helps us answer the question: “Where are users going to from event X?” and “How are users getting to event Y?”
Conclusion
As a product analyst, your major job is not just to find creative ways to share insights across your organisation but also finding meaningful ways to empower others to discover insights on their own. To fully take the advantage of data, data blending is a useful concept which is merging data from different sources for analysis. This helps us to see data from different perspectives. Going forward as a product analyst, it is a standard practise to automate reports to help reduce drudgery while improving reliability.
P.S: This is a summary gotten from the Product Analytics course at CXL Institute.
 Powerful things you can do with the Markdown editor